Data Analytics and Visualization - Bootcamp - 9 lessons - 6 classes
As a student of the Data Analytics and Visualization course, you will experience project-based learning over the course of two weeks. Your learning will include both in-person classroom time as well as additional time required for project work outside of classroom hours.
This session of the Data Analytics and Visualization course will meet September 20th – October 1st from 9am – 12pm on Monday, Wednesday, and Friday. Additional virtual help office hours will be available on Tuesdays and Thursdays from 9am – 12pm.
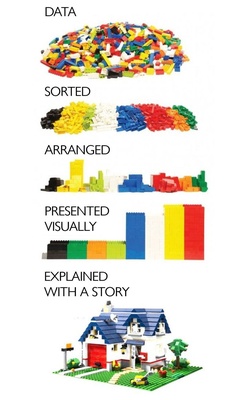
As a student of the Data Analytics and Visualization course you explore an overview of data analytics and visualization and its importance in the modern workplace. During this course we will explore practical frameworks for analyzing data as we prepare to tell meaningful data stories using documents, presentations, and dashboards both in-person and virtually.
Download Course Overview Here
Lesson 1: Introduction to Data Analytics
Topic A: What is Data Analytics?
Topic B: Types of Data Analytics
Topic B: Stages of Data Analytics
Topic C: Frameworks for Data Analytics
Topic D: Data Analysis Tools
Lesson 2: Introduction to Data Visualization
Topic A: What is Data Visualization
Topic B: Different Types of Data Visualization
Topic C: Data visualization process
Topic C: Creating a Visualization Toolkit
Topic D: Data Visualization Tools
Lesson 3: Telling a Story with Data
Topic A: The art of telling a story with data
Topic B: Personas and Audience Analysis
Topic C: Prioritizing, Optimizing, and Designing the Data Story
Topic D: Using Design, Color and Language
Lesson 4: Data Gathering
Topic A: Identifying Data for Analysis and Visualization
Topic B: Introduction to Data Sources
Topic C: How to Gather and Import Data
Topic D: Preparing and Cleaning Data
Lesson 5: Preparing Data for Visualization
Topic A: Clean and Transform Data
Topic B: Managing Lists of Data
Topic C: Formulae
Topic D: Leverage Pivot Tables
Lesson 6: Visualizing Data with Charts and Graphs
Topic A: Choose the Right Visualization
Topic B: Telling the Story with Design
Lesson 7: Visualizing Data using Dashboards
Topic A: Visualization Methods
Topic B: Dynamic Data
Topic C: Design Principles
Topic D: Manage User Access
Lesson 8: Visualizing Data using Presentations
Topic A: Designing Data for Presentations
Topic B: Using Motion to Visualize Data
Topic C: Effective Presentation Techniques
Lesson 9: Presenting Data Effectively
Topic A: Methods for Presenting Data
Topic B: Presenting Data in an in-Person Meeting
Topic C: Presenting Data in a Virtual Meeting
Images
Date and Time
Monday Sep 20, 2021 Friday Oct 1, 2021
September 20th – October 1st from 9am – 12pm on Monday, Wednesday, and Friday. Additional virtual help office hours will be available on Tuesdays and Thursdays from 9am – 12pm.
Location
Ivy Tech - Hamilton County Campus
300 N. 17th Street
Noblesville, IN 46060
Fees/Admission
This course is available at no cost for the first 20 registrants, thanks to the support of the Hamilton County Community Foundation, Ivy Tech, and the City of Noblesville.
Contact Information
Bob DuBois
Send Email
